When we gaze upon the majestic structures of wind turbines fracturing the skyline, we often overlook the intricate dance of physics and engineering that enables them to harness the environmental wind energy efficiently. Have you ever pondered how these colossal machines convert the capricious whims of wind into a steady stream of electrical power? Understanding the wind turbine power curve is crucial to appreciate this process fully. This article will guide you through how to draw and understand a wind turbine power curve, illustrating its significance in the realm of wind energy.
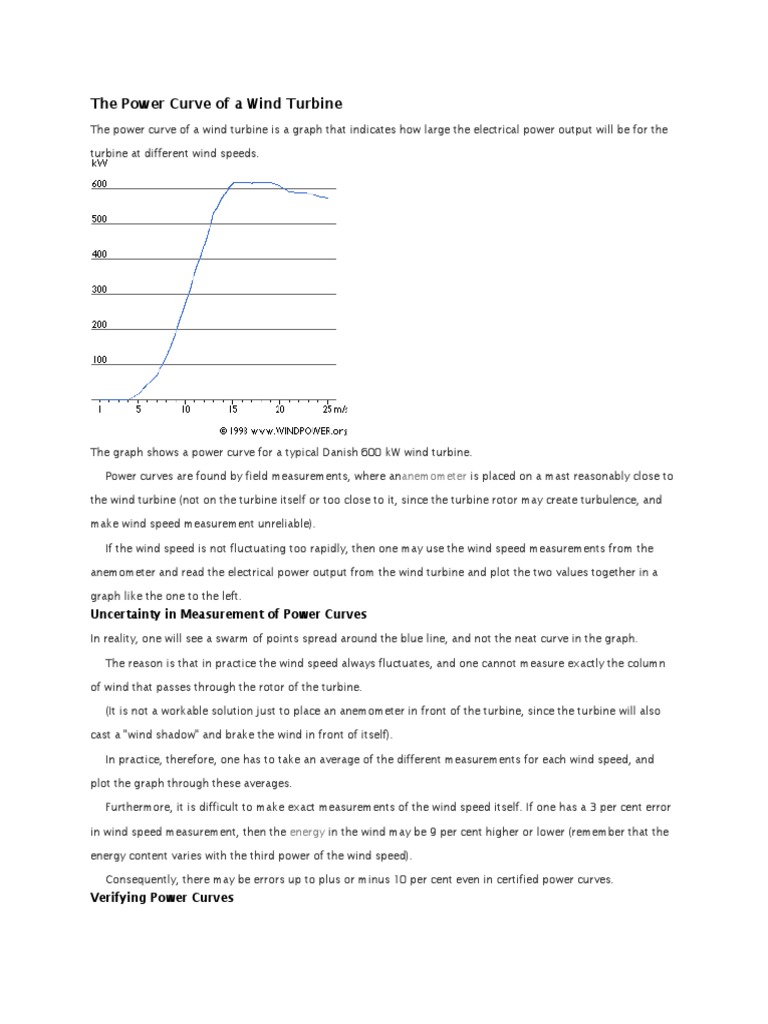
At its core, the power curve of a wind turbine encapsulates the relationship between wind speed and the electrical power output that a turbine can provide. But before diving into the technicalities, let’s consider a playful question: What happens when the wind blows too gently or too vigorously? The answer lies within the confines of the power curve, a graph that reveals both the strengths and limitations of wind energy generation.
The **first step** in comprehending a wind turbine power curve is recognizing its key components. The curve typically features four distinct regions, starting with the **cut-in speed**. This is the minimum wind speed at which the turbine blades begin to rotate, approximately ranging from 3 to 4 meters per second (m/s) for most turbines. Below this threshold, the turbine remains idle, failing to generate any power. As the wind speed increases beyond this point, the turbine begins to harness energy, and power output gradually escalates.
Next, we traverse the **rated speed**. This pivotal point signifies the wind speed at which the turbine reaches its maximum output capacity, usually around 12 to 14 m/s. Beyond this, the turbine does not produce more power, existing in a state of curtailed output. Understanding this phenomenon emphasizes the importance of selecting the appropriate turbine design for specific wind conditions, a challenge faced by many renewable energy planners.
Transitioning to the **cut-out speed**, we encounter the upper threshold limit of wind speed tolerance for turbines, generally situated between 25 to 30 m/s. In these tempestuous conditions, turbines will automatically shut down to prevent damage. This self-regulatory mechanism is vital, subtly managing the forces at play to ensure longevity and operational safety. Herein lies an intriguing dilemma: How do engineers ensure that turbines can withstand the unpredictable nature of wind without compromising the efficiency of energy production?
Forging onwards, let’s consider the **functionality** of the turbine and its blade design. The blades are meticulously crafted to convert kinetic energy from the wind into rotational energy. This transformation is fundamental to power generation, yet it presents inherent challenges. Engineers must find a delicate balance between shape, material, and aerodynamics to optimize performance. How does one predict the ideal dimensions and angles for blades to maximize energy capture while sustaining resilience against storms?
To accurately **draw** the power curve, one must compile empirical data from testing under various wind conditions. This requires sophisticated equipment to measure wind speed and corresponding power output. Once data is collated, plotting the values on a graph becomes the next essential step. The x-axis typically represents wind speed, while the y-axis showcases electrical power output. This visual representation enables stakeholders to make informed decisions about turbine installation and energy forecasting.
Moreover, understanding **how external factors** influence the power curve is crucial. Variations in temperature, air density, and altitude can significantly affect performance. Turbines situated at higher elevations may experience improved wind speeds, thereby producing more energy. However, such benefits must be weighed against increased maintenance costs and logistical challenges.
The narrative of wind energy doesn’t stop here; it flourishes into broader implications for our planet. The adoption of wind energy could serve as a beacon for environmental stewardship, reducing our reliance on fossil fuels and addressing climate change. However, the transition to renewable sources presents societal challenges: how do we facilitate community acceptance of wind farms while navigating the complexities of land use and visual impact? The dialogue surrounding renewable energy is often contentious, illuminating the delicate intricacies of balancing progress and preservation.
Lastly, grasping the full significance of the wind turbine power curve extends beyond technical expertise. It poses a critical challenge for policymakers and engineers alike—to innovate continuously, explore new technologies, and improve energy yield while mitigating ecological disturbances.
The power curve serves not merely as a static measurement but rather as a dynamic tool that compels us to rethink energy generation strategies. It invites us to engage in thoughtful discussions about sustainability and the future of our energy landscape.
In conclusion, understanding the wind turbine power curve is foundational for anyone engaging in the renewable energy sector. By dissecting its components and recognizing its wider implications, we equip ourselves with the knowledge to champion wind energy solutions confidently. As these turbines continue to dot our horizons, their power curves remind us of the delicate interplay between nature’s forces and human ingenuity in pursuing a sustainable future.


Leave a Comment