
Los Angeles continues to grapple with smog because a mix of vehicle emissions, basin geography, and climate patterns trap pollutants, creating a persistent air‑quality challenge.
\n\n
Quick Answer
\n
Smog in Los Angeles is the result of high concentrations of nitrogen oxides (NOx) and volatile organic compounds (VOCs) reacting under sunlight to form ozone and fine particulate matter. The city’s basin shape and frequent temperature inversions prevent vertical mixing, so pollutants linger near the ground. Evidence from the U.S. EPA and California Air Resources Board shows that traffic remains the dominant source, while climate‑driven heat waves amplify formation. The health impact is measurable, especially for asthma‑prone populations, though exact future trends depend on policy implementation and climate variability.
\n
\n\n
Key Takeaways
\n
- \n
- Vehicle exhaust is the primary source of ozone‑forming pollutants in Los Angeles.
- The surrounding mountains create temperature inversions that trap smog in the basin.
- Long‑term monitoring shows a modest decline in some pollutants, yet ozone levels remain above federal standards.
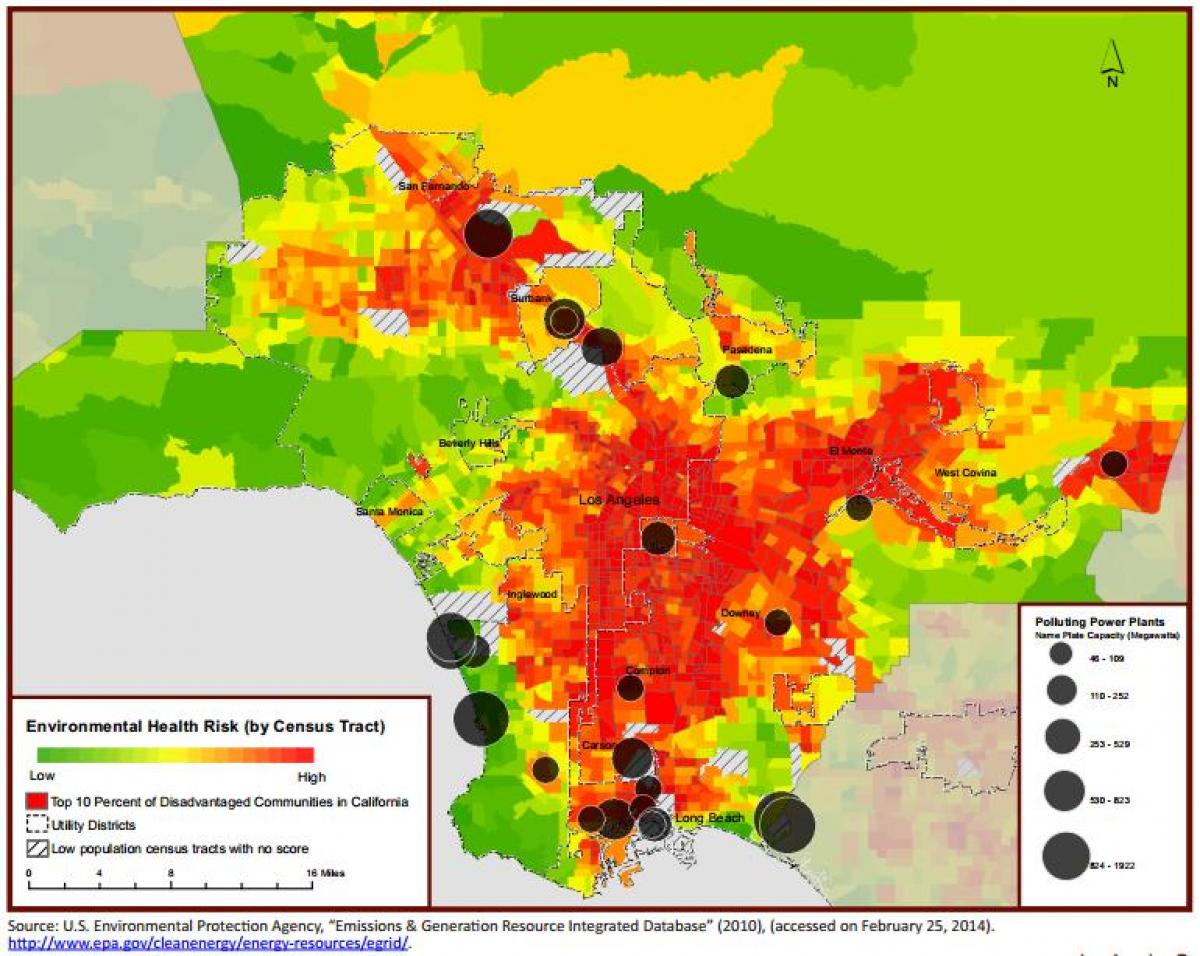
- Low‑income neighborhoods near freeways experience higher exposure and health risks.
- Effective solutions combine stricter emissions standards, expanded public transit, and targeted community programs.
\n
\n
\n
\n
\n
\n
\n\n
What Is Air Pollution in Los Angeles: Why the Smog Problem Persists?
\n
Air pollution in Los Angeles refers to the mixture of gases and particulate matter that degrades ambient air quality. The most visible symptom is photochemical smog— a brownish haze formed when NOx and VOCs react under strong sunlight to produce ozone (O₃) and secondary aerosols. The term encompasses primary pollutants emitted directly from sources (e.g., tailpipes, industrial stacks) and secondary pollutants created through atmospheric chemistry. Understanding this mix is essential because it drives both environmental degradation and public‑health outcomes.
\n\n
How Does It Work?
\n
1. Emission Sources Release Precursors
\n
Cars, trucks, and diesel buses emit NOx and VOCs; refineries and manufacturing plants add additional VOCs and sulfur dioxide (SO₂). According to the California Air Resources Board, transportation accounts for roughly 40 % of total NOx emissions in the region (2021 data).
\n
2. Sunlight‑Driven Chemical Reactions Form Ozone
\n
In the presence of ultraviolet radiation, NOx and VOCs undergo a series of reactions that generate O₃ and peroxyacetyl nitrate (PAN). This process peaks in the late morning and early afternoon, explaining why smog is most intense during summer heat waves.
\n
3. Basin Topography Limits Dispersion
\n
Los Angeles lies in a coastal basin encircled by the San Gabriel, Santa Monica, and Verdugo Mountains. When a high‑pressure ridge sits over the region, a temperature inversion forms—a warm layer aloft that suppresses vertical air movement. Pollutants become trapped near the surface, increasing concentrations of ozone and fine particulate matter (PM₂.₅).
\n
4. Feedback Loops Intensify Episodes
\n
Higher ozone levels can heat the lower atmosphere, strengthening inversions, which in turn retain more pollutants—a positive feedback that can prolong smog episodes for several days.
\n\n
What Does the Evidence Show?
\n
Long‑term monitoring by the U.S. EPA’s Air Quality System indicates that average annual PM₂.₅ concentrations in Los Angeles County have fallen from 15 µg/m³ in the early 2000s to about 8 µg/m³ in 2020, reflecting successful particulate controls. However, the same data set shows that the 8‑hour ozone standard (70 ppb) is still exceeded on roughly 30 % of summer days (2022 monitoring report). Peer‑reviewed studies attribute the residual ozone to persistent traffic emissions and the basin’s limited ventilation. Climate‑model assessments suggest that future warming could increase the frequency of high‑ozone days unless emissions are sharply reduced.
\n\n
Main Causes or Drivers
\n
Direct Causes
\n
- \n
- Exhaust from gasoline‑powered passenger vehicles (dominant source of NOx and VOCs).
- Diesel trucks and buses contributing higher NOx per mile.
- Industrial facilities emitting VOCs and SO₂.
\n
\n
\n
\n
Underlying Drivers
\n
- \n
- Urban sprawl that encourages car dependence; Los Angeles’ median commute exceeds 30 minutes.
- Car‑centric culture reinforced by low fuel taxes and ample parking.
- Population growth— the metro area added ~2 million residents between 2000 and 2020, increasing total emissions.
\n
\n
\n
\n
Amplifying Factors
\n
- \n
- Geographic basin that traps air masses.
- Frequent summer heat waves driven by regional climate change.
- Occasional wild‑fire smoke that adds additional PM₂.₅ and ozone precursors.
\n
\n
\n
\n\n
Environmental and Human Impacts
\n
Environmental Impacts
\n
Elevated ozone accelerates plant stress, reducing agricultural yields in the Inland Empire. Fine particles contribute to regional haze, lowering visibility in national parks such as the San Bernardino National Forest. Acidic deposition from NOx and SO₂ can affect soil chemistry and aquatic ecosystems.
\n
Human Health and Social Impacts
\n
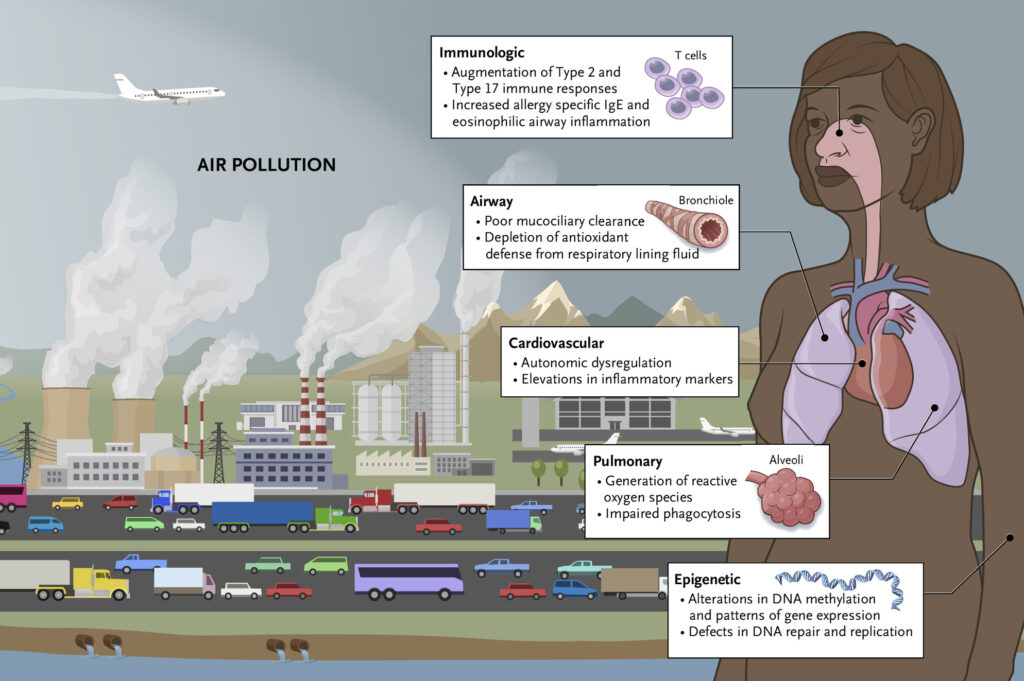
Exposure to ozone and fine particulate matter in Los Angeles is linked to increased asthma attacks, reduced lung function, premature cardiovascular deaths, and higher rates of respiratory hospital visits, especially among children and low‑income residents living near busy freeways.
\n
Economic and Infrastructure Impacts
\n
Smog‑related health costs are estimated at $2 billion annually in California (2021 economic analysis). Visibility impairment reduces tourism revenue in coastal areas, while frequent alerts strain emergency services.
\n\n
Regional Differences
\n
Within the Greater Los Angeles area, air quality varies sharply. Coastal districts such as Santa Monica benefit from marine breezes that dilute pollutants, often meeting federal standards. In contrast, inland valleys like the San Fernando Valley experience the highest ozone concentrations due to weaker ventilation and denser traffic corridors. These intra‑regional patterns illustrate how micro‑topography and land‑use interact with emissions.
\n\n
What Scientists Know With High Confidence
\n
- \n
- Vehicle exhaust is the leading source of NOx and VOCs that form ozone in the Los Angeles basin.
- Temperature inversions driven by the surrounding mountains significantly reduce vertical mixing, trapping pollutants.
- Long‑term monitoring confirms a decline in PM₂.₅ but persistent exceedance of ozone standards during summer.
- Exposure to ozone and fine particles increases respiratory morbidity, with disproportionate impacts on low‑income communities.
\n
\n
\n
\n
\n
\n\n
What Remains Uncertain
\n
Key uncertainties include the magnitude of future ozone formation under different climate‑change scenarios, the effectiveness of emerging electric‑vehicle adoption rates, and the health impact of combined wildfire smoke and urban smog. Data gaps in real‑time monitoring of traffic‑related VOCs also limit precise source attribution. Improved sensor networks and longitudinal health studies could reduce these uncertainties.
\n
\n\n
Common Misconceptions
\n
Misconception: “Los Angeles’ smog is only a problem in summer.”
\n
Reality: While ozone peaks in summer, particulate pollution can be elevated year‑round, especially during wildfire events that transport smoke into the basin.
\n
Misconception: “Electric cars automatically solve the smog problem.”
\n
Reality: EVs reduce tailpipe NOx, but upstream electricity generation and the continued presence of older gasoline vehicles still contribute substantially to ozone precursors.
\n
Misconception: “Air‑quality regulations have no effect.”
\n
Reality: Stringent emissions standards introduced in the 1990s are credited with the observed decline in PM₂.₅; however, ozone remains challenging due to its complex chemistry.
\n
\n\n
Solutions and Limitations
\n
Effective response strategies must address both emissions and the basin’s meteorology.
\n
- \n
- Regulatory standards: Tightening NOx and VOC limits for vehicles and industry has proven effective, yet enforcement gaps can allow older high‑emitting fleets to persist.
- Transportation shift: Expanding rail lines and bus rapid transit reduces vehicle miles, but high upfront costs and entrenched car culture slow adoption.
- Cleaner technology: On‑road electrification and retrofitting diesel trucks lower tailpipe emissions, though electricity must be sourced from low‑carbon generation to realize full benefits.
- Urban planning: Promoting mixed‑use development shortens commute distances, yet zoning reforms face political resistance.
- Community programs: Targeted air‑quality alerts and school‑based filtration improve exposure for vulnerable groups, but they do not address the source of pollution.
\n
\n
\n
\n
\n
\n\n
What Individuals, Communities, and Governments Can Do
\n
What Individuals Can Do
\n
- \n
- Choose low‑emission transportation modes (public transit, car‑pool, biking) for daily trips.
- Maintain vehicle engines and tire pressure to improve fuel efficiency.
- Use air‑purifying filters at home during high‑ozone alerts.
- Support local measures that expand clean‑energy infrastructure.
\n
\n
\n
\n
\n
What Communities and Organizations Can Do
\n
- \n
- Implement neighborhood monitoring networks to identify hotspots.
- Advocate for equitable placement of green spaces that can locally reduce particulate levels.
- Partner with schools to provide indoor air‑quality improvements.
\n
\n
\n
\n
What Governments Can Do
\n
- \n
- Enforce stricter vehicle inspection programs and accelerate retirement of high‑emitting cars.
- Invest in high‑capacity electric‑bus fleets and dedicated bus lanes.
- Adopt basin‑wide emission caps that account for both local and regional sources.
- Allocate funding for research on ozone chemistry under future climate scenarios.
\n
\n
\n
\n
\n\n
Closing Synthesis
\n
Los Angeles’ smog persists because traffic‑derived pollutants are repeatedly trapped by the city’s basin geography and reinforced by climate‑driven heat. Robust evidence confirms the central role of vehicle emissions and temperature inversions, while uncertainties remain about future climate interactions and technology adoption rates. A balanced portfolio of stricter regulations, clean‑transport investments, and community‑focused interventions offers the most realistic path toward clearer skies and healthier residents.
\n
Frequently Asked Questions
What causes the persistent smog in Los Angeles?
Persistent smog in Los Angeles is caused mainly by nitrogen oxides and volatile organic compounds from vehicle exhaust and industrial activities that react under strong sunlight to form ozone and fine particles, while the surrounding mountains create temperature inversions that trap these pollutants near the ground.
How does the basin geography of Los Angeles affect air quality?
The Los Angeles basin is surrounded by mountains that block vertical air movement; when a warm layer forms aloft, it creates a temperature inversion that prevents pollutants from dispersing upward, causing them to accumulate at street level and intensify smog.
What health problems are linked to Los Angeles smog?
Exposure to ozone and fine particulate matter in Los Angeles is linked to increased asthma attacks, reduced lung function, premature cardiovascular deaths, and higher rates of respiratory hospital visits, especially among children and low‑income residents living near busy freeways.
Which policies have been most effective at reducing LA’s air pollution?
California’s strict vehicle‑emissions standards and the phase‑down of high‑sulfur fuels have led to measurable declines in particulate matter, while the expansion of public‑transit corridors and incentives for electric vehicles have begun to curb ozone‑forming precursors, though full ozone compliance remains elusive.
What actions can residents take to protect themselves from smog?
Residents can reduce personal exposure by checking daily air‑quality alerts, limiting outdoor activity during high‑ozone periods, using indoor air filters, choosing low‑emission transportation, and supporting community initiatives that promote clean‑energy and equitable air‑quality monitoring.








Leave a Comment